Profile of Contacts
Diagram 1
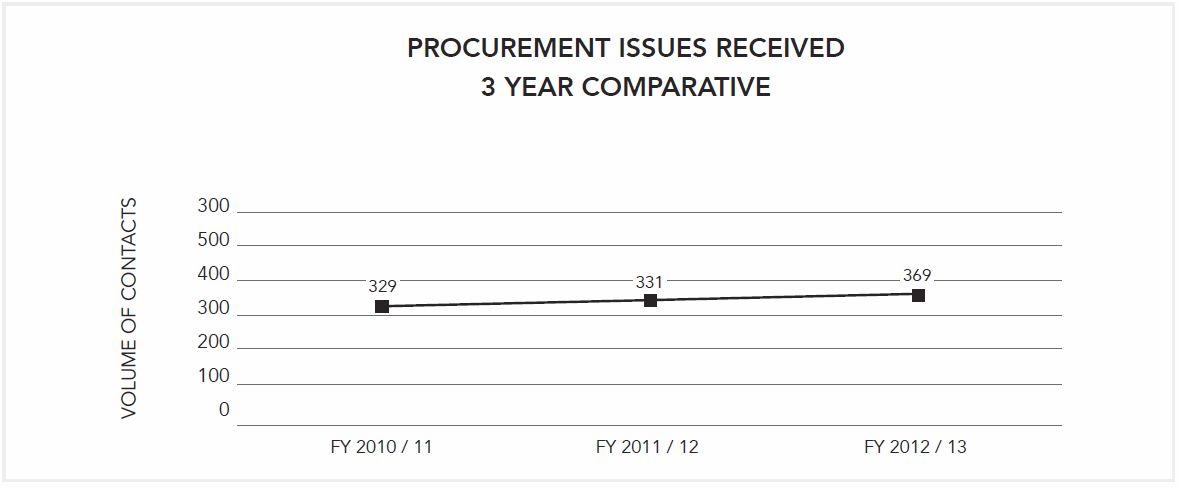
Text Version
This diagram illustrates the number of total contacts received by the Office of the Procurement Ombudsman over the last three years. The fiscal years are illustrated from left (2010-11) to right (2012-13). The volume of contacts rose from 329 in the 2010-11 fiscal year to 331 in 2011-12. The volume of contacts then rose to 369 in 2012-13.As illustrated in Diagram 1, the Office of the Procurement Ombudsman (OPO) processed 369 telephone, e-mail, fax and in-person contacts this past year. This represents an 11% increase in the number of contacts from the previous year. Our objective in dealing with these contacts is to provide factual and timely information in a neutral and impartial manner.
Of the 369 contacts, 136 (37%) were general and non-procurement-related in nature. They consisted of inquiries from members of the general public attempting to reach a government department or experiencing difficulty with a government program and not knowing where to turn (e.g. questions regarding travel or health insurance, immigration, banking). Regardless of the issue, OPO staff worked diligently in playing the role of pathfinder and in providing support and information.
The remaining 233 contacts (63%) were procurement-related, ranging from general inquiries (e.g. how to do business with the federal government, where to find information on a specific topic) to inquiries from stakeholders pursuing a specific federal procurement (e.g. asking about the details of a solicitation or the rules governing a particular procurement process).
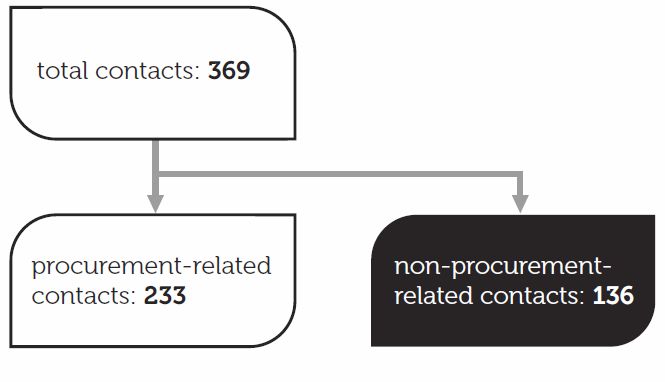
Diagram 2
Text Version
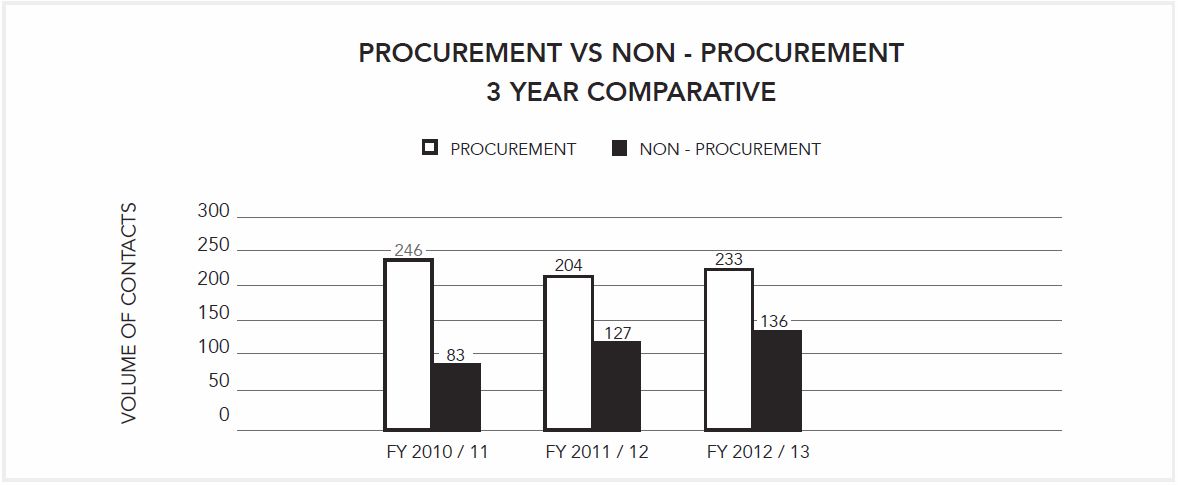
This diagram illustrates the ratio of procurement-related contacts to non-procurement-related contacts over the last three fiscal years. The 2010-11 fiscal year is illustrated on the far left of the chart. In 2010-11, the number of procurement-related contacts was 246 and the number of non-procurement-related contacts was 83. To the right of 2010-11 is the 2011-12 fiscal year. In 2011-12 the number of procurement-related contacts was 204 and the number of non-procurement-related contacts was 127. Further to the right of 2011-12 is the 2012-13 fiscal year. In 2012-13, the number of procurement-related contacts was 233 and the number of non-procurement-related contacts was 136.While Diagram 2 illustrates that the Office has experienced an increase in the volume of procurement-related contacts from 2011-2012, the ratio of procurement-related contacts to non-procurement-related contacts has remained relatively stable. Procurement-related contacts represented 62% of the total number of contacts in 2011-2012 and 63% in 2012- 2013. The three strategic pillars Educate, Facilitate and Investigate provide the structure for the remainder of the report beginning with the Educate pillar.
- Date modified: