Profile of Contacts
577 Total Contacts
414 Procurement-Related
163 Non-Procurement-Related
During the 2014-2015 fiscal year the Office received 577 contacts from individuals seeking assistance of one kind or another. Diagram 1 illustrates these 577 contacts as a 76 contact (15%) increase from the previous year, and an increase of 246 contacts (74%) in the four full fiscal years of the current Ombudsman’s mandate.
Of the 577 contacts, 163 (28%) were non-procurement-related, meaning inquiries from members of the general public who were often attempting to reach a government department or experiencing difficulty with a non-procurement-related government program. The number of non-procurement-related contacts to the Office has dropped slightly from 190 last year, a decline of 27 (14%). The increase in total contacts coupled with the corresponding decrease in the number of non-procurement-related contacts suggests more of the people contacting the Office are doing so with a better understanding of our mandate. While the 163 contacts did not pertain to a procurement issue, the Office did its best to provide the required information and/or to put the individual in touch with the appropriate resource who could provide assistance.
The remaining 414 (72%) contacts were primarily from Canadian business people raising issues which were procurement-related. Diagram 2 illustrates the number and trend of procurement-related contacts over the past four years. The diagram shows an increase of 103 (33%) procurement-related contacts over the previous year, and an increase of 210 (103%) since 2011-2012. This 33% increase last year demonstrates an ongoing and steady increase in the number of suppliers contacting the Office for help.
Diagram 1
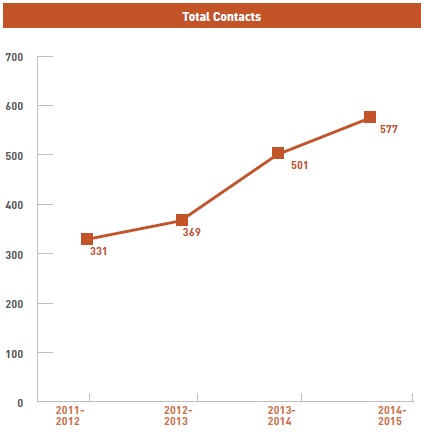
Image Description
This diagram illustrates the number of total contacts received by the Office of the Procurement Ombudsman over the last four years. The fiscal years are illustrated from left (2011/2012) to right (2014/2015). The volume of contacts rose from 331 in the 2011/2012 to 369 in 2012/2013 and to 501 in 2013/2014. The volume of contacts then rose to 577 in 2014/2015.
Diagram 2
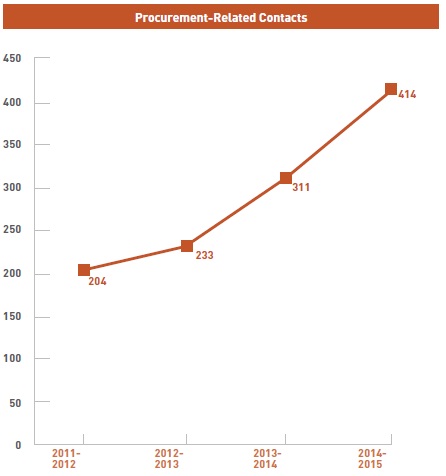
Image Description
This diagram illustrates the number of procurement-related contacts received by the Office of the Procurement Ombudsman over the last four years. The fiscal years are illustrated from left (2011/2012) to right (2014/2015). The volume of procurement-related contacts rose from 204 in the 2011/2012 to 233 in 2012/2013 and to 311 in 2013/2014. The volume of contacts then rose to 414 in 2014/2015.
- Date modified: