Profile of Contacts
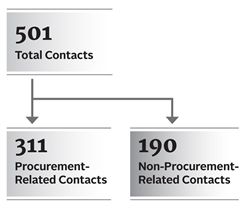
Image description
This diagram identifies the number of total contacts received by the Office of the Procurement Ombudsman in the 2013-14 fiscal year as 501. This total number is then broken down below into procurement-related contacts (311) and non-procurement-related contacts (190).
Each year the Office is contacted by hundreds of Canadians seeking assistance of one kind or another. While the majority contact us to discuss a procurement-related issue, others need different types of help; for example, finding the appropriate department to deal with a problem they are experiencing. Regardless of the nature of the call, we do what we can to assist those who contact us. The 501 contacts represent an increase of 132 contacts (36%) from the 369 contacts in 2012–2013 (Diagram 1).
Of the 501 contacts, 190 (38%) were non-procurement-related, meaning inquiries from members of the general public regarding such things as attempting to reach a government department or experiencing difficulty with a non-procurement-related government program. This past year saw an increase of 54 (40%) non-procurement-related contacts.
The remaining 311 (62%) contacts were procurement-related and are detailed in the remainder of the report.
Diagram 1
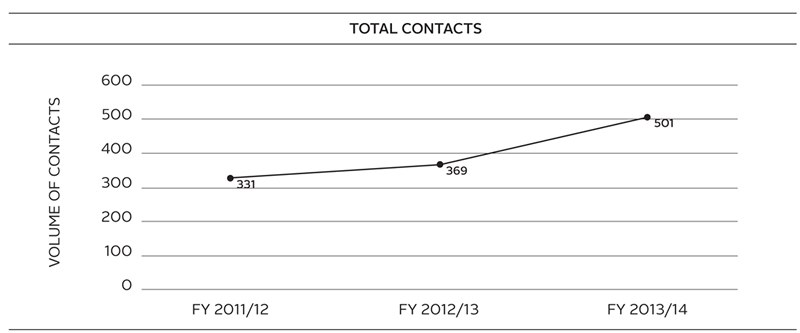
Image description
This diagram illustrates the number of total contacts received by the Office of the Procurement Ombudsman over the last three years. The fiscal years are illustrated from left (2011/12) to right (2013/14). The volume of contacts rose from 331 in the 2011/12 fiscal year to 369 in 2012/13. The volume of contacts then rose to 501 in 2013/14
Diagram 2 illustrates an increase of 78 (33%) procurement-related contacts over the previous year and 107 (52%) since 2011–12 and reveals an ongoing increase in the number of Canadians contacting the Office for help.
Diagram 2
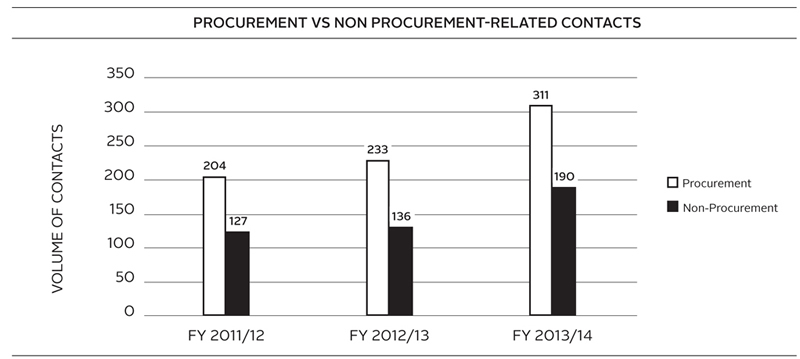
Image description
This diagram illustrates the ratio of procurement-related contacts to non-procurement-related contacts over the last three fiscal years. The 2011-12 fiscal year is illustrated on the far left of the chart. In 2011-12, the number of procurement-related contacts was 204 and the number of non-procurement-related contacts was 127. To the right of 2011-12 is the 2012-13 fiscal year. In 2012-13 the number of procurement-related contacts was 233 and the number of non-procurement-related contacts was 136. Further to the right of 2012-13 is the 2013-14 fiscal year. In 2013-14, the number of procurement-related contacts was 311 and the number of non-procurement-related contacts was 190.
OPO's three pillars — Educate, Facilitate and Investigate — provide the structure for understanding the nature of OPO's activities as well as how we handled the 311 procurement-related contacts, beginning with the Educate pillar.
- Date modified: